
Synthetic Monitoring
Test your key pages, endpoints, and critical flows continuously from around the world. Build powerful monitoring scripts and run them on a schedule with Playwright, Browser Bots, or Protocol Bots. Detect downtime and broken flows before your users are impacted.
Synthetic monitoring runs scripted checks on a schedule, from outside your own infrastructure, so problems get caught even when nobody is on the site. Set up your first monitor here, or read the synthetic monitoring guide first.
Just want a one-off check? Run a free website speed test, then turn it into a monitor later.
Uptime checks tell you something loaded. Scripted monitoring tells you customers can actually complete your site's critical flows.
A simple uptime check requests a URL and looks for a 200 response. That catches a full outage, and not much else. With basic uptime monitoring in place, a site could pass every uptime check while login, search, or checkout is quietly broken behind it.
Loadster monitors go beyond basic uptime monitoring to execute complete user journeys. A monitoring script can log in, navigate through several pages, fill out a form, and verify that each step returned what it should. If any step fails or exceeds your response time threshold, the cycle fails and Loadster opens an incident.
There's a big difference between knowing your site is up and knowing it works end-to-end. Read Synthetic Monitoring: Tools and Techniques for a deeper look at why basic uptime checks alone are insufficient.
Monitor with real headless Chrome browsers or scriptable HTTP clients. Loadster supports Browser Bots, Protocol Bots, and Playwright.
Record a script with the free browser extension, build one in the web-based editor, or bring the Playwright Test scripts your team already maintains and run them on a schedule from the cloud. Each script can be as simple as a single page load or API call, or as long as a full multi-step journey.

Browser Bots
Record scripts in your browser with Loadster's free extension and edit them visually. Add JavaScript if necessary. Browser Bots automate real headless Chrome browsers for realistic web application testing with a minimal learning curve.
 4X
4X

Protocol Bots
Protocol Bots execute scripted HTTP/S requests against your API or static website. Testing at the protocol layer is cost-effective and easily scales to hundreds of thousands of concurrent bots, and is ideal for testing HTTP APIs at scale.
1X

Playwright
Run your Playwright Test scripts at scale through Loadster's cloud. Ideal for teams already using Playwright or who want programmatic control with an open source testing framework, combined with Loadster's cloud scaling and reporting.
4X
Everything you need to monitor and troubleshoot your site. Loadster keeps detailed logs, screenshots, and diagnostics from each monitoring cycle.
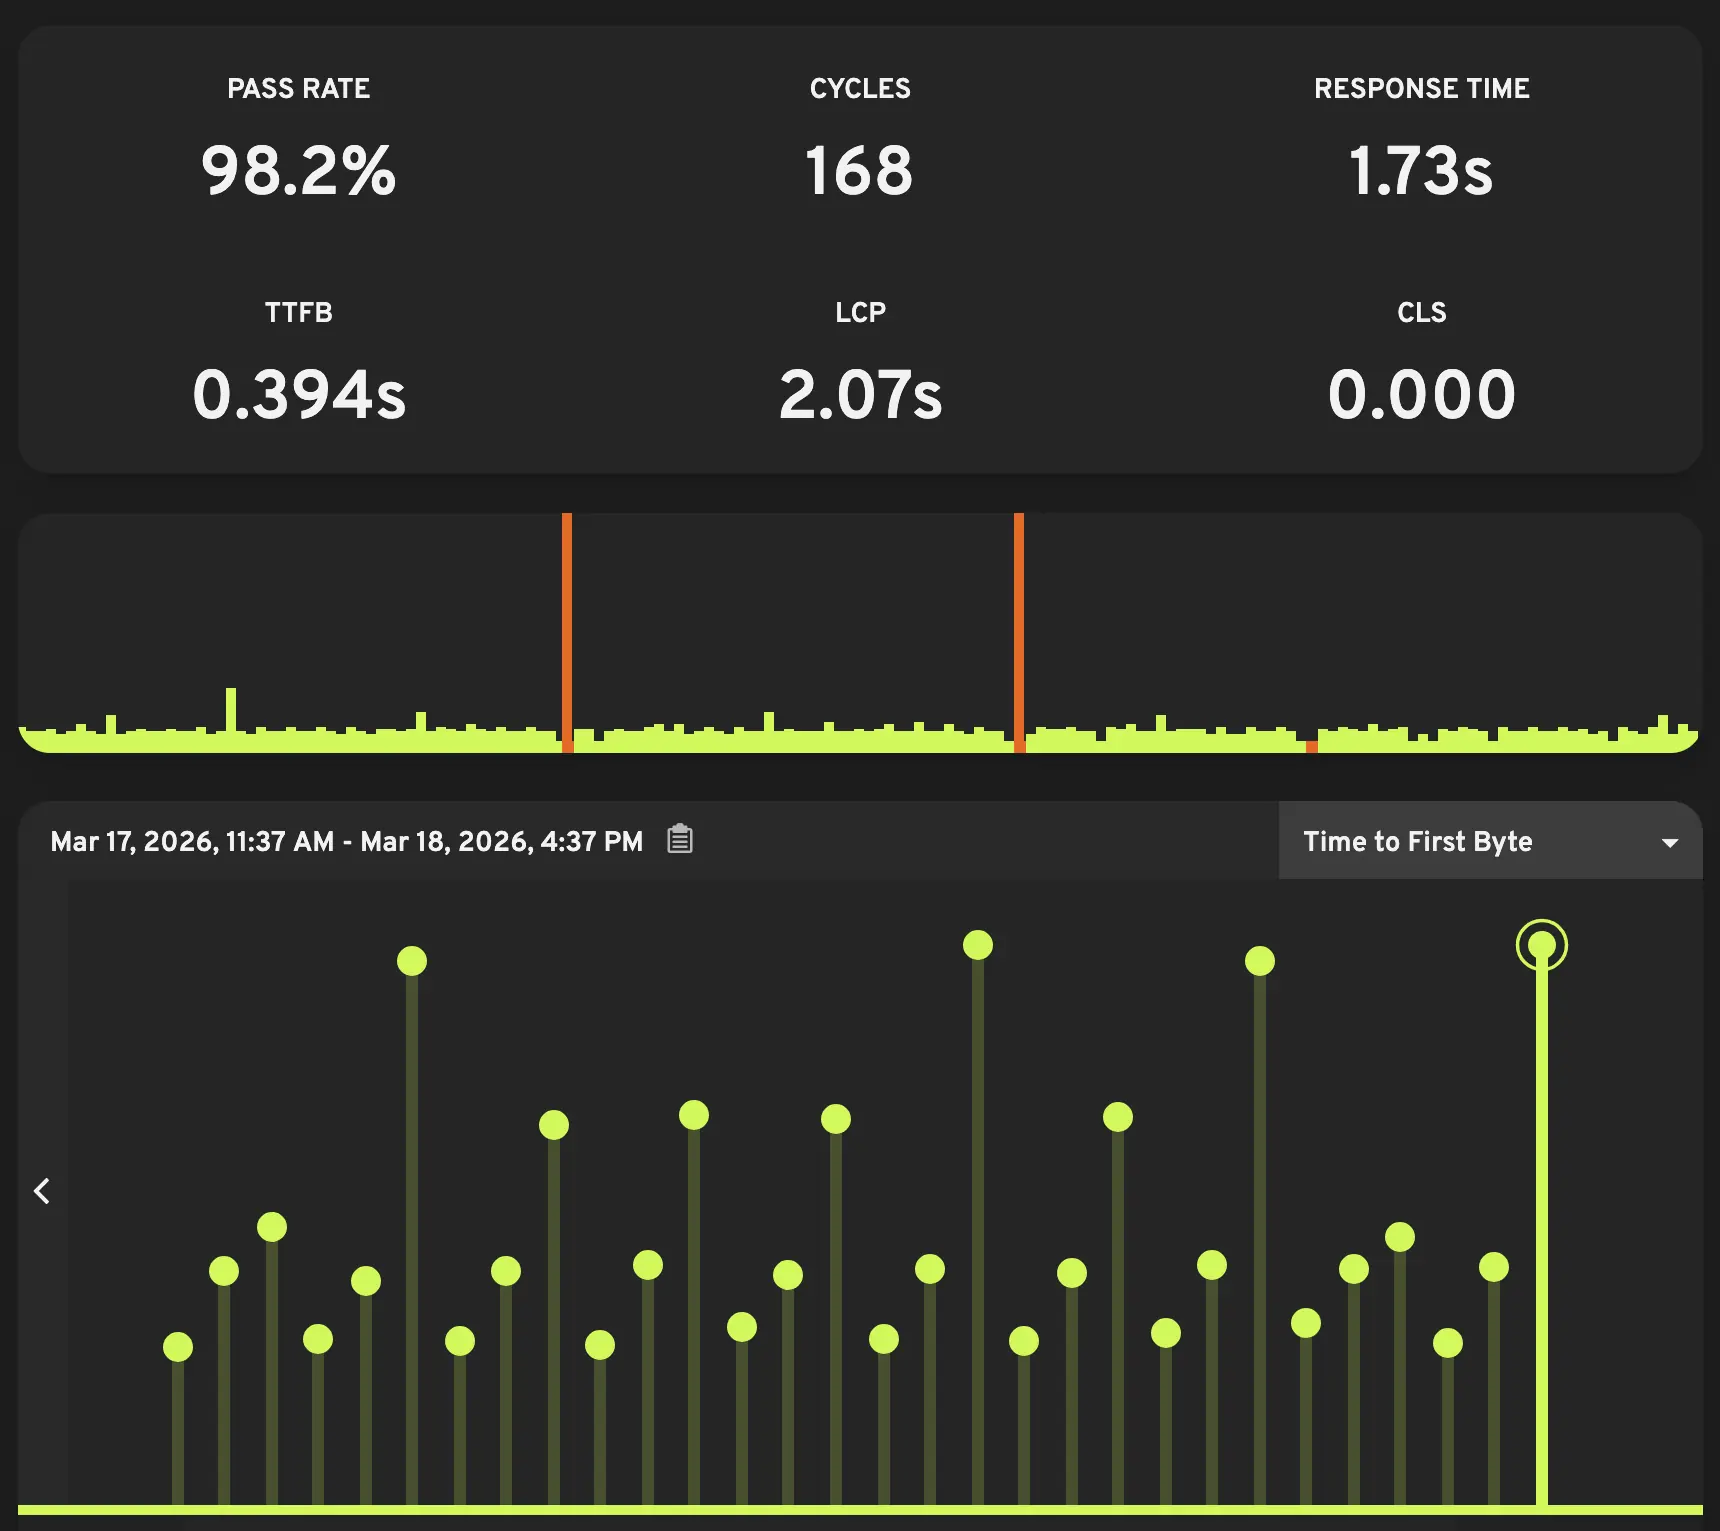
Track uptime, availability, and functionality
Monitors constantly check whether your site is up and whether the scripts complete successfully. Loadster tracks the outcome of every cycle and calculates your uptime percentage, so you can keep tabs on uptime, downtime, and failed cycles in the monitoring dashboard.
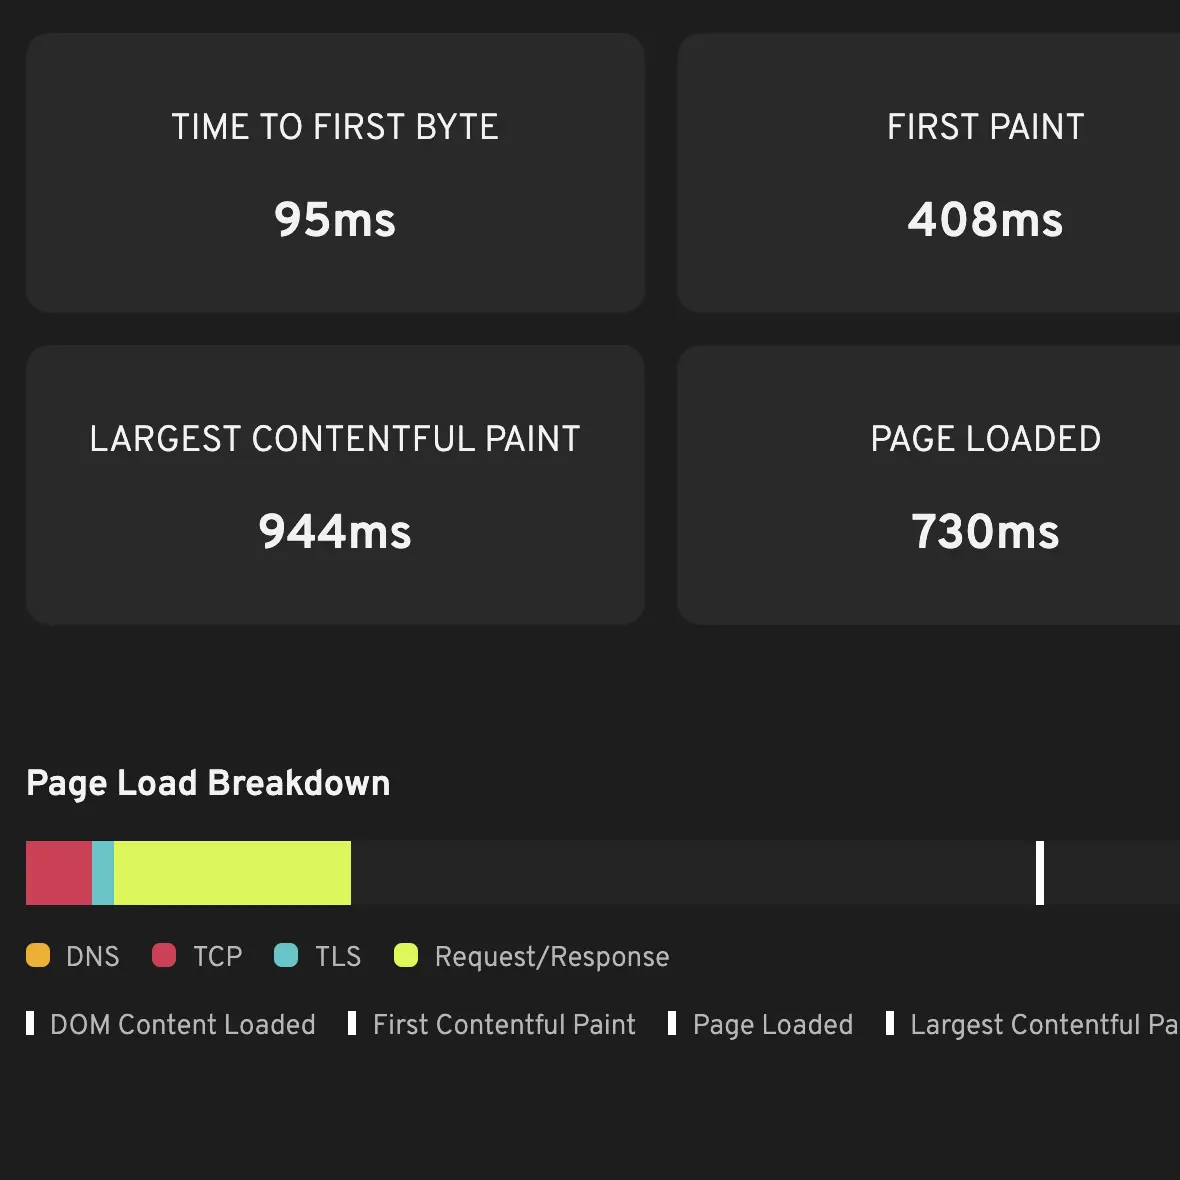
Analyze performance and Core Web Vitals over time
Browser-based monitors capture real browser metrics including Time to First Byte (TTFB), First Contentful Paint (FCP), Largest Contentful Paint (LCP), and Cumulative Layout Shift (CLS). Watching them over time catches the slow regressions that a one-off speed test can't.
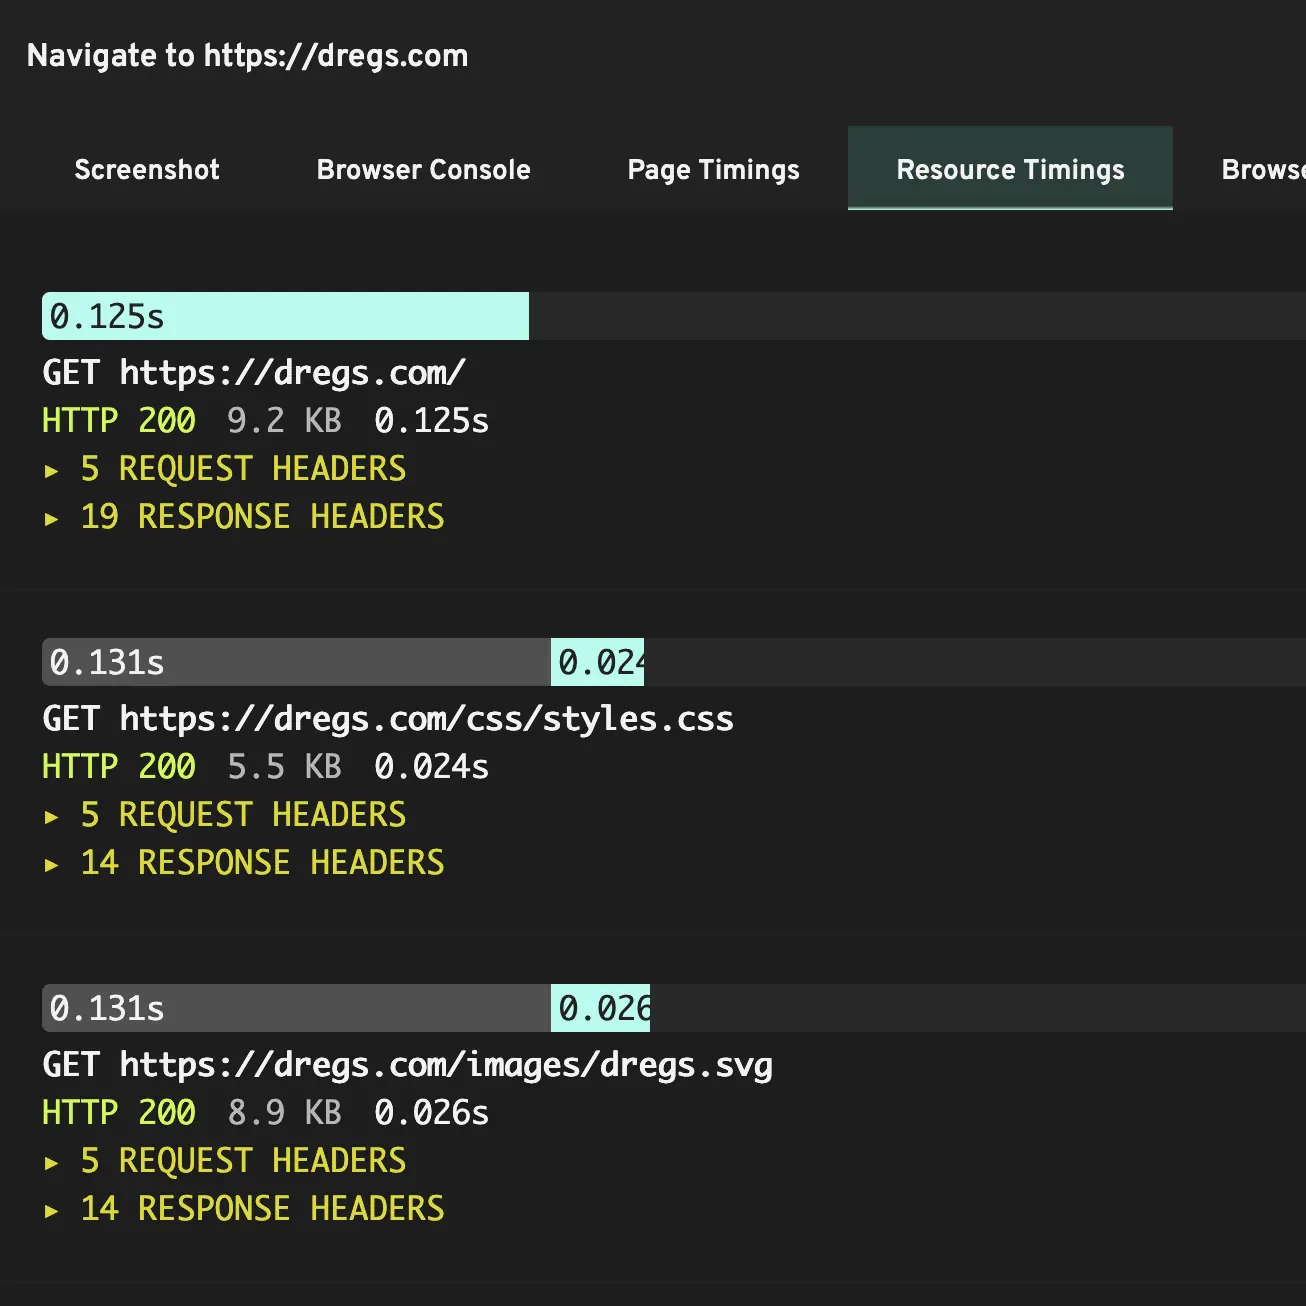
Capture detailed traces and screenshots
Every monitor cycle stores full request and response details and, for browser-based monitors, screenshots showing exactly what the bot saw at each step. When a cycle fails, the trace usually points straight at the failing request or page.
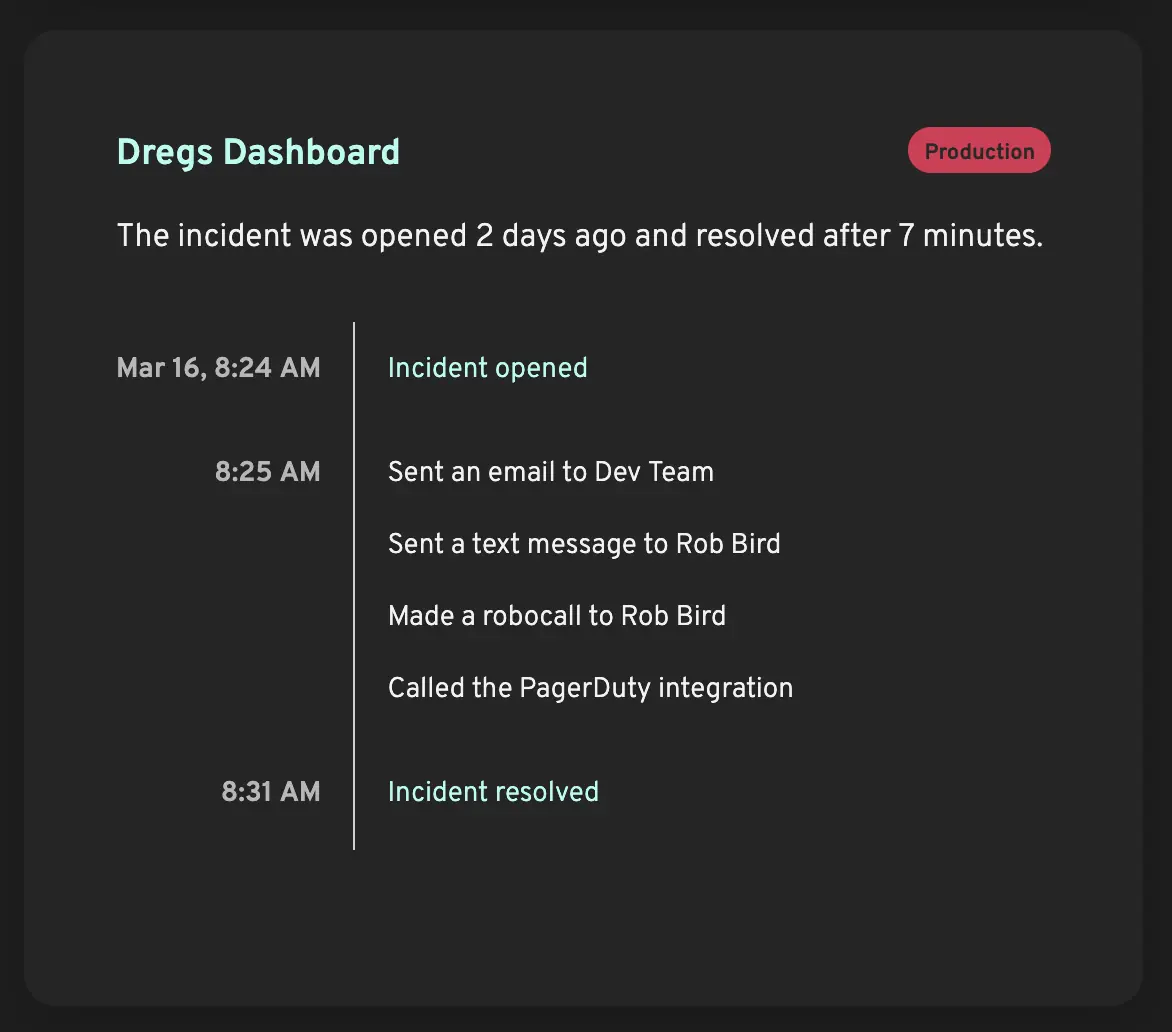
Escalate with incidents and alerts
When a monitor detects a problem, Loadster opens an incident to track it until resolution and alerts your team according to your notification policies. Once the monitor passes again, the incident closes automatically.
When your monitors detect trouble, you'll know about it first. Control who, when, and how to alert with team notification policies.
When a monitor uncovers a problem with your site, Loadster notifies you through your specified channels. Each alert includes a direct link to the failed monitor cycle so you can immediately start debugging.
 Email
Email
 Text/SMS
 Phone Call
 Opsgenie
 PagerDuty
 VictorOps
 Webhooks
Set up custom notification policies to control who on your team gets notified, by what channels, and how long after an incident is opened or resolved.
For example, you might email your team on the first failure, escalate to SMS after 5 minutes, and trigger a phone call after 15 if the incident is still open.
Monitor your site from around the world. Choose from 8 dedicated locations across 5 continents.
Running checks from outside your own infrastructure tests more of the path your users depend on. An internal health check might miss an expired TLS certificate, a DNS problem, a CDN failure, or a routing issue that only affects one region.
Each monitor can run from multiple locations at once, so you can verify that your site stays fast and available for users around the world and tell a global outage apart from a regional one.
Simple usage-based pricing. Loadster scales with your monitoring.
Take your pick between two pricing models, depending on how heavily you monitor your site. Neither one charges per test run.
Pay-As-You-Go Fuel
Starting at $97 for 1,000 units
Every monitor cycle burns a small amount of Loadster Fuel. Fuel usage depends on the script duration, cycle frequency, and bot type. Monitors typically use just a few units per day.
Fuel PricingMonitoring Plans
Starting at $29/month
Monitoring plans include thousands of fuel-free monitoring cycles each month, plus phone notifications (SMS and calls). Ideal if you run frequent monitors across multiple flows.
Plan PricingReuse your monitoring scripts for load and stress testing. Same scripts, same platform.
The scripts you run as monitors can also power load tests with thousands of concurrent bots, or a stress test that keeps ramping until it finds your site's breaking point. Instead of one bot on a schedule, a load test runs thousands at once to simulate heavy traffic.
Load tests report response times, throughput, and errors live from every bot, so you can watch where the application gives way first and fix it before real traffic finds it.
Monitoring catches the problems that happen between releases. Load testing catches the ones that would have happened at peak traffic. Together they cover a lot of ground.
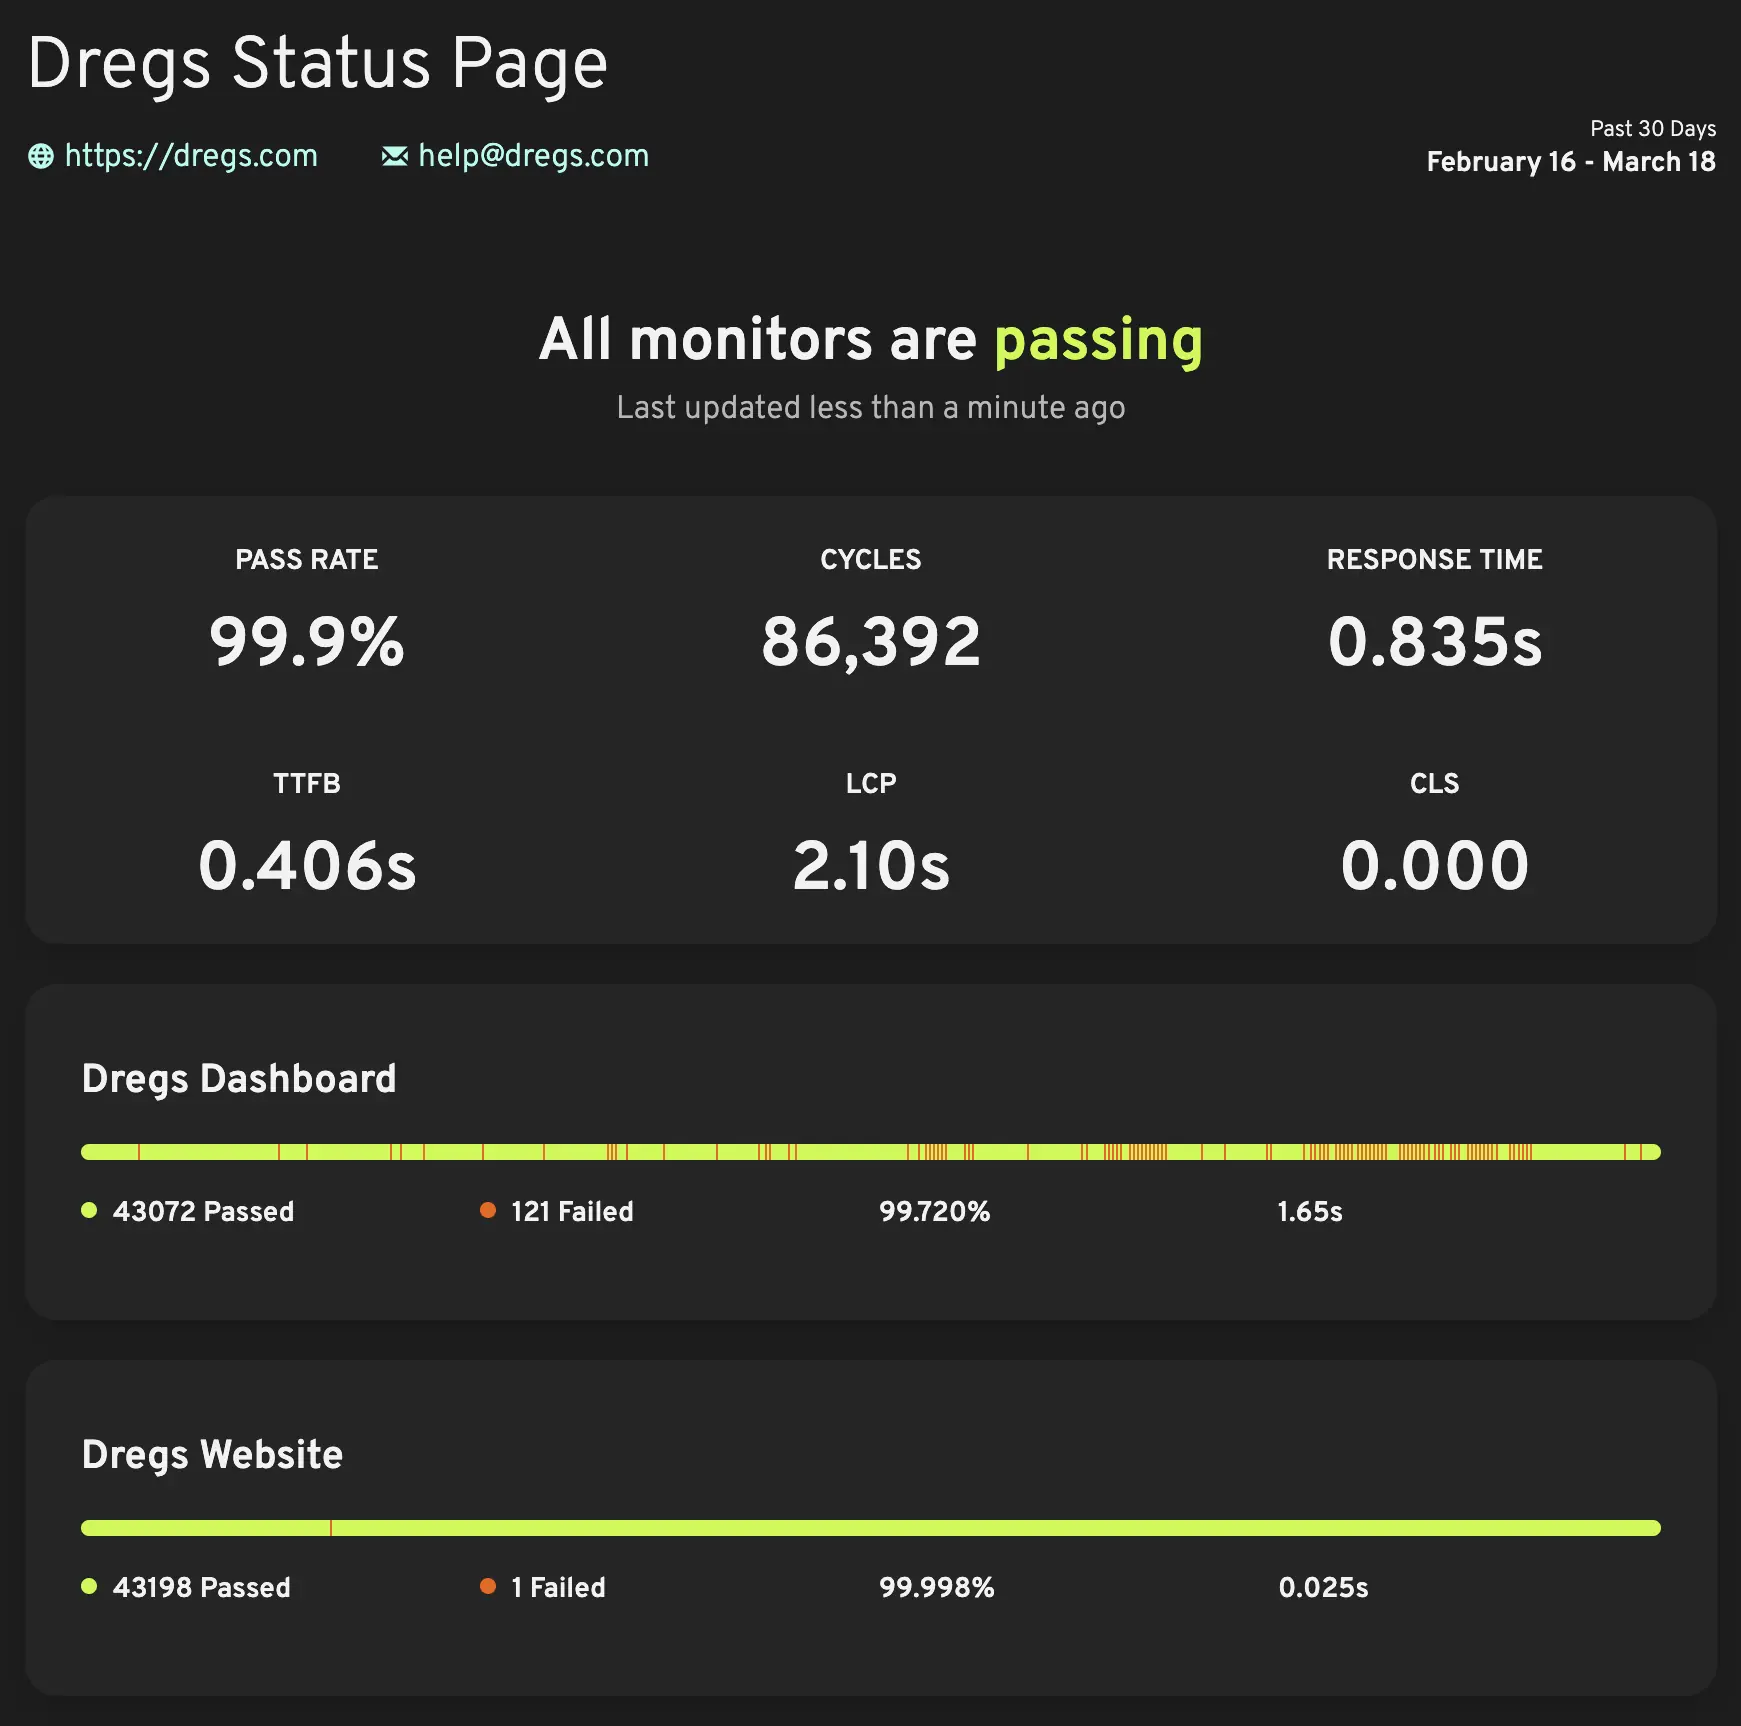
Hosted status pages are free. Share your uptime results privately or publicly.
If you want, you can share your site's uptime and performance monitoring data privately with your team or publicly with your customers.
Loadster's hosted status pages display real-time monitor status and uptime history for the monitors you designate. Communicate incidents transparently and build trust with your colleagues, stakeholders, and users.
You're in complete control of which monitors get shared, and you can create multiple status pages with different sets of monitors on each. If you control your domain's DNS records you can even set up a custom domain for your status page to match your brand.
Loadster has optimized the performance, scalability, and uptime of thousands of sites. We're proud to be a testing platform of choice to elite teams.


Keep calm
Monitor your site
Ready to reduce your site's risk of downtime?
Start free with 50 units of Loadster Fuel.